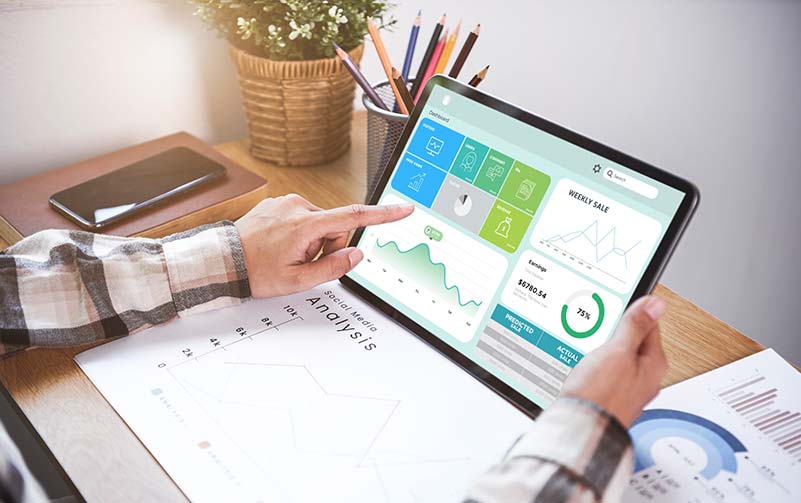
Rich Analytics To Help You Take Better Decisions
Consolidate and organise all your data in one place, spot patterns and trends, identify gaps and opportunities, and go from ad-hoc to data-driven decisions

Pull Data In From Multiple Sources
Build and consolidate customer profile and behavior data from multiple sources, channels and connected systems, in your CRM database. Richer data, leads to deeper insights, and better decisions.
Build Your Own Reports
Other than standard built-in reports, you can use use custom fields and conditions to build your own custom reports, relevant to your business context and roles and responsibilities.
Add the fields you need in your report, and configure these fields for visibility, sorting, grouping, display, labels, links, and computations.
Make your reports more dynamic and contextual with conditions (rules) for different fields.

Visualise Your Data
The right visualization can help you derive the right insights, quickly. Choose a visualization that illustrates the key impact of a metric or data parameter on the goals you are driving towards.
Tables are a great way to compile and consolidate key data from multiple sources in one place, and are suitable for futher actions like sorting, grouping, and filtering.
Charts add a useful visualization layer, reducing complexity, and helping your brain focus on a specific dimension or angle. These are great tools to help you see the big picture. Auro CRM supports Pie Charts, Bar Charts, Line Charts, Radar Charts, Stacked Bars, and Grouped Bars out-of-the-box.
Slice, Dice, and Dive Deep
Auro CRM reports are “live” and actionable. You can click through to the level of detail you are looking for.
Sorting helps you quickly get to the top data points you are looking for – highest priority, most valuable, closest deadline etc.
Simple and advanced filters are useful when you want to work on a very specific subset of data, say a particular customer segment, or tasks assigned to you, or your team.
Groups help you consolidate and summarize data along specific dimensions, e.g. average order value for customers who placed the order on mobile phone in the last 3 months.
Drag-and-Drop Dashboard
One of Auro CRM’s most powerful and useful features.
Users can build their own set of dashboards, where each dashboard contains a set of custom reports called dashlets. These dashlets are updated in real-time.
Dashboards help users save a lot of time (that would otherwise be spent browsing and finding that information on a periodic basis). They double up as a daily planner and organiser tool. Dashboards and dashlets can be shared with team members, and promote excellent collaboration too!


"AuroCRM connected with our SageERP and able to generate multiple reports which helped us to look at real time data and track performance of sales team and product demand. "
– Mahmoud Paridehpour, Information System & E-Commerce Manager, Four Seasons General Merchandise


